Mice
All animal procedures were approved by and performed in accordance with the guidelines of the Institutional Animal Care and Use Committee (IACUC) at Washington University in St. Louis. Mice were housed in a specific-pathogen-free (SPF) facility managed by the Division of Comparative Medicine at Washington University School of Medicine, which is fully accredited by AAALAC International. Mouse holding rooms were maintained in a controlled environment with an ambient temperature of 20–24 °C and a relative humidity of 40–60%. Mice were kept on a regulated 12-h light–12-h dark cycle and provided with standard laboratory chow and water ad libitum. Ube3a-deficient mice were generated previously44 and obtained through Jackson Laboratory (016590). The mice used throughout this study were all maintained on a C57BL6/J background. Angelman mice (Ube3am−/p+) were generated by crossing Ube3am+/p− heterozygous females with WT males. An Asns-heterozygous mouse was generated at the Washington University Mouse Genetics Core using a guide RNA to generate a deletion of a single nucleotide at the Q17 codon on exon 2 of Asns (chr. 6: 7689452, GRCm39 assembly). Mice were backcrossed at least seven generations with WT C57Bl/6J mice (Ube3am+/p+; Asns+/+) before use in the study. mRNA of Cas9 and the selected gRNA were injected into fertilized hybrid C57Bl/6J/JxCBA eggs at the Mouse Genetics Core at Washington University School of Medicine and validated by targeted Sanger sequencing. Mice were genotyped by incubating tail-tips overnight at 55 °C in tail digest buffer (0.1 M Tris pH 8.8, 0.5 M NaCl, 0.005 M EDTA and 0.5% SDS) containing 0.4 mg ml−1 proteinase K (Gold Biotechnology, P-480-SL10). Afterwards, proteinase K was inactivated by incubation at 95 °C for 10 min and genomic DNA was purified by isopropanol precipitation. PCR was performed by amplifying a 486-bp fragment using forward primer 5′-GGTGCAGGGTTTATGGTTGGA-3′ and reverse primer 5′-GCTTACCGCCTTGTGGTTGTAG-3′. The products were purified using a PCR purification kit (QIAGEN, 28106) and submitted for Sanger sequencing (GENEWIZ). PCR was performed using MyTaq DNA polymerase (Meridian Bioscience, BIO-25043) with an initial denaturation step of 95 °C for 1 min, followed by 30 cycles of denaturation at 95 °C for 15 s, annealing at 60 °C for 15 s and an extension step of 72 °C for 55 s.
Cell lines and culture
HEK293T cells and Neuro2a cells, obtained from ATCC, were cultured in a 5% CO2 humidified incubator and tested regularly for mycoplasma contamination. Cells were maintained in Dulbecco’s modified Eagle’s medium (DMEM) pre-supplemented with GlutaMAX (Gibco, 10569044), 5% fetal bovine serum (FBS; Gibco, 16140071) and 1% antibiotic–antimycotic solution (Gibco, 15240096) containing 10,000 units ml−1 penicillin, 10,000 µg ml−1 streptomycin and 25 µg ml−1 of amphotericin B. For biochemical analysis, transfections were done using the FuGENE 6 transfection reagent (Promega, E2691), according to the manufacturer’s instructions.
We established a stable UBE3A-KD cell line (HEK293T) by using an shRNA (Sigma, TRCN0000012894; target sequence: CCCAATGATGTATGATCTAAA) against the UBE3A gene. A lentiviral construct containing a scrambled shRNA sequence (Sigma, SHC002) was used as a control. pLKO.1-puro-UBE3A shRNA and scrambled shRNA were transfected into HEK293T cells and stable clones were selected with 1 μg ml−1 puromycin. Despite consecutive optimization trials to maximize silencing efficiency, the viable stable clones consistently exhibited a moderate reduction of about 25% in steady-state UBE3A expression levels. However, this level of knockdown proved biologically sufficient to elicit robust biochemical alterations in downstream target proteins. For proteasome inhibition assays, cells were treated with 15 μM MG132 (Calbiochem, 474790) for 12 h before collection, and cells treated with an equal volume of dimethyl sulfoxide (DMSO) served as the vehicle control.
Primary cortical neurons were cultured and maintained using the B-27 Plus neuronal culture system (Gibco, A3653401) supplemented with N2 (Gibco, 17502048) and penicillin–streptomycin (Gibco, 15140122). In brief, embryos were isolated at embryonic day 14.5 (E14.5) and the cortex of WT and Angelman mice was dissected. The tissue was dissociated using a trypsin solution and mechanical trituration to obtain a single-cell suspension. After dissociation, cells were seeded onto cell culture dishes pre-coated with poly-d-lysine (Sigma-Aldrich, P0899). Half of the neuronal culture medium was replaced every 2 days until the desired day of the experiment.
Plasmids and AAVs
MYC-tagged human UBE3A isoform 2 constructs used in this study, including WT, ligase dead (LD; C829A), UBE3A(T485A) and UBE3A(T485E), were cloned into the pCIG2 plasmid DNA as previously described4,5. This vector is driven by a chicken β-actin promoter with bicistronic GFP expression via an internal ribosome entry site (IRES). The WT HA-tagged ASNS construct, derived from human ASNS and containing the complete reading frame (accession: BC014621.2), was cloned into the pCIG2 plasmid using PCR to introduce SacI and XmaI sites. The constructed plasmids were verified by DNA sequencing (GENEWIZ) and purified using a HiSpeed Plasmid Midi Kit (QIAGEN, 12643). The oligonucleotide sequences used to generate WT HA–ASNS and five lysine mutants of ASNS (K83R, K168, K467, K478 and K504) are provided in Supplementary Table 6. The HA codons are shown in red, and the blue colour indicates the presence of restriction sites. Lysine mutations in the oligonucleotides used for mutagenesis are shown in bold. To create viral expression vectors, WT HA–ASNS was subcloned into pAAV-hSyn-EGFP plasmid DNA (Addgene, 50465) by PCR using a KpnI site. To separate ASNS from EGFP, we inserted a 2A self-cleaving peptide (T2A) at the 5′ end of ASNS. Control virus and AAV-hSyn-WT-HA-ASNS-T2A-EGFP were packaged into AAV2/9n capsids (Addgene, 112865) with an AAV helper plasmid and pAdDeltaF6 (Addgene, 112867), and transfected into HEK293T cells at a 1:1:1 molar ratio using PEI MAX (Polysciences, 24765-100). AAVs were purified using the AAVpro Purification Kit (Takara, 6666) and titred using a qPCR AAV titration kit (Applied Biological Materials, G931). Primary neurons were transduced with AAVs at a multiplicity of infection of 7.5.
Ubiquitin remnant immunoaffinity profiling with SILAC and LC–MS/MS
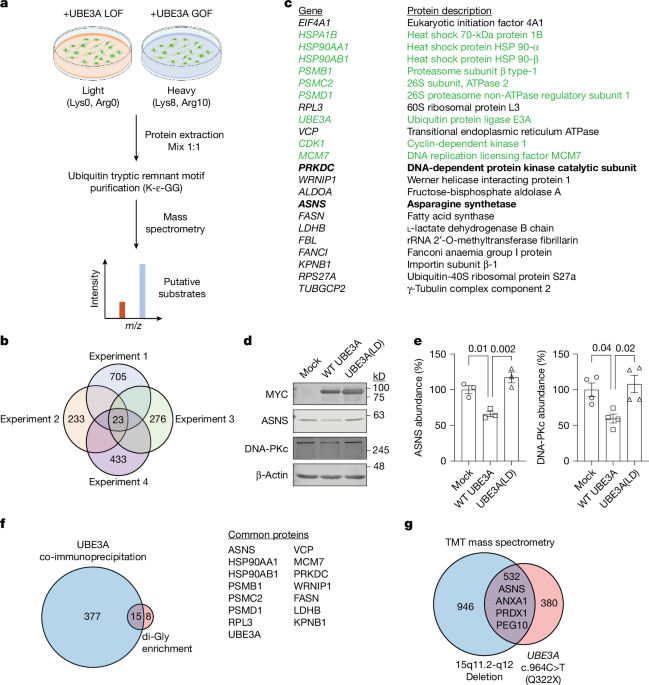
HEK293T cells expressing UBE3A(T485A) and UBE3A(T485E) constructs were cultured in DMEM supplemented with high glucose, GlutaMAX supplement and pyruvate (Gibco, 10569044), 10% dialysed FBS (Gibco, 26400044), 1% antibiotic–antimycotic solution containing 10,000 units ml−1 penicillin, 10,000 µg ml−1 streptomycin and 25 µg ml−1 amphotericin B (Gibco, 15240096). For heavy labelling, 50 µg ml−1 13C6, 15N2 l-lysine (Lys8) and 40 µg ml−1 13C6, 15N4 l-arginine (Arg10) (Cambridge Isotope Laboratories, CNLM-291-H-PK and CNLM-539-H-PK, respectively) were added to the medium for cells expressing UBE3A(T485A). For cells expressing UBE3A(T485E) in light medium, standard 50 µg ml−1 l-lysine and 40 µg ml−1 l-arginine (Thermo Fisher Scientific, J62225.36 and A15738.36, respectively) were used. Cells were maintained in their respective labelled or standard medium for at least seven passages to ensure complete labelling. Subsequently, the cells were lysed using a lysis buffer (8 M urea in 50 mM Tris-HCl, 150 mM NaCl, 1 mM EDTA, 2 µg ml−1 aprotinin, 10 µg ml−1 leupeptin, 1 mM PMSF, 50 µM deubiquitinating enzyme (PR-619) and 1 mM iodoacetamide). The lysates were then centrifuged at 20,000g at 4 °C for 15 min, and the protein concentration was determined using a Pierce BCA protein assay kit (Invitrogen, 23227). Equal amounts of lysates from cells cultured in heavy and light media were mixed in a 1:1 ratio (mg:mg). The mixture was diluted in 50 mM Tris (pH 7.5) to a final concentration of 2 M urea. Total protein was enzymatically digested overnight at a 1:100 ratio (trypsin:protein) using sequencing-grade modified trypsin (Promega, V5111). The resulting peptides were purified on a Sep-Pak column (Waters) and eluted with a 40-ml step gradient of 10–50% acetonitrile and 0.1% trifluoroacetic acid (TFA) (10%, 15%, 20%, 23%, 30%, 35%, 40% and 50%: 5 ml each). Each fraction was lyophilized overnight. The lyophilized peptides were subjected to immunoaffinity purification using a PTMScan Ubiquitin Remnant Motif (K-ɛ-GG) Kit (Cell Signaling Technology, 5562). The peptide solution was transferred into the vial containing motif antibody beads, and the mixtures were incubated on a rotator for 4–6 h at 4 °C. K-ɛ-GG peptides were eluted with 50 μl of 0.15% TFA after washing the bead slurry with phosphate-buffered saline (PBS) and water. Eluted peptides were further purified using Pierce C18 spin columns (Thermo Fisher Scientific, 89870) following the manufacturer’s instructions. The peptides were eluted with 70% acetonitrile and 0.1% TFA solution in 50-μl volumes twice and then lyophilized using a SpeedVac.
For mass-spectrometry analysis, lyophilized peptides were resuspended in 1% acetonitrile and 0.1% formic acid. Each sample was analysed using LC–MS/MS (EASY nLC 1000 coupled with QExactive HF mass spectrometer; Thermo Fisher Scientific). The samples were injected onto an EASY-Spray PepMap C18 column (75 μm inner diameter × 25 cm; 2 μm particle size) and separated using a gradient consisting of 5–35% mobile phase B at a flow rate of 250 nl per min flow rate, with mobile phase A consisting of 0.1% formic acid in water and mobile phase B consisting of 0.1% formic acid in acetonitrile. The QExactive HF was operated in data-dependent mode, selecting the 15 most intense precursors for subsequent fragmentation. The resolution (m/z 400–1,600) for the precursor scan was set to 120,000, with a target value of 3 × 10⁶ ions. The resolution of the MS/MS scan was set to 30,000, with a target value of 1 × 10⁵ ions. For higher-energy collision dissociation, we set the normalized collision energy to 27% and the separation window to 1.6 m/z. We set peptide matches as preferred and excluded precursors with unknown charge or charge states of 1 and ≥7. Raw data files were processed using Proteome Discoverer (v.2.1) (Thermo Fisher Scientific). The peak list was searched against the reviewed human UniProt database (containing 20,203 entries) with the contaminant database added using Sequest (v.2.1). For protein identification, the following parameters were used to identify the trypsin peptide: 10 ppm precursor ion mass tolerance, 0.02-Da product ion mass tolerance, a maximum of two missing trypsin cleavage sites, carbamidomethylation of Cys set as a fixed modification and oxidation of Met, gly-gly of Lys, Ser/Thr/Tyr, [13C6]Arg, [13C6]Lys and acetylation of the N terminus set as variable modifications. We used Percolator (v.2.05) to estimate the number of false positive identifications and assigned a q-value of 0.05 (5% FDR), which was used to filter all results. We used the ptmRS node (v.2.1) to assign a probability of post-translational modification site localization. To determine the SILAC rate for ubiquitin-modified peptides, we enabled peptide quantification. For two replicates (experiments 2 and 3), we note that there was a polymer present in our di-Gly motif pull-downs that caused the LC column to become partially clogged, leading to a reduction in the number of total detected proteins. Consequently, owing to these replication-specific technical issues, the total numbers of detected proteins varied across individual replicates, and candidates were filtered on the basis of unique protein comparisons across all valid trials.
Cross-referencing of patient-derived proteomic data
To assess how the identified candidate substrates are altered in human neurons, the compiled list of 55 previously proposed substrates, along with ASNS and DNA-PKc, was cross-referenced against a previously published embryonic-stem-cell-derived proteomic dataset from patient-derived AS neurons (Supplementary Table 2). This clinical dataset comprised upregulated protein profiles from two independent patient-derived backgrounds: a line containing a large maternal deletion encompassing UBE3A (ΔChr. 15q11.2–q12) and a line containing a premature truncating nonsense mutation in the maternal UBE3A allele (Q322X). Overlapping proteins between our candidate screen and the 532 commonly upregulated proteins in both patient lines were identified to extract high-confidence disease-relevant substrates.
Western blot and immunoprecipitation
Cultured cells or mouse brain tissue were lysed in ice-cold RIPA buffer for western blotting or cold modified RIPA buffer for immunoprecipitation. The composition of the RIPA buffer was as follows: 50 mM Tris-HCl (pH 7.4), 150 mM NaCl, 1% Triton X-100, 0.1% sodium dodecyl sulfate and 0.25% sodium deoxy-cholate. For western blotting, an EDTA-free protease (Thermo Fisher Scientific, 78437) and phosphatase (Thermo Fisher Scientific, 78428) inhibitor cocktail was added to the RIPA buffer. For immunoprecipitation, 5 mM EDTA and protease and phosphatase inhibitor cocktail were included in the modified RIPA buffer. After lysis, the samples were centrifuged, and protein concentrations were determined using a Pierce BCA protein assay kit (Invitrogen, 23227). Equal amounts of protein were resuspended in 1× LDS sample buffer (Thermo Fisher Scientific, 84788), separated by SDS–PAGE, and transferred onto nitrocellulose membranes (Cytiva, 10600002). Membranes were blocked in 1× fish gelatin blocking agent (Biotium, 22010) in Tris-buffered saline (TBS) containing 0.1% Tween 20 (TBST) for 1 h at room temperature. Afterwards, membranes were incubated with primary antibodies at 4 °C overnight. Bands were visualized using secondary antibodies, either IRDye 680RD donkey anti-mouse IgG (Li-Cor, 926-68072) or IRDye 800CW donkey anti-rabbit IgG (Li-Cor, 926-32213), used at a dilution of 1:10,000. Protein bands were analysed using the Odyssey CLx infrared imaging system and Image Studio v.5.2 software (Li-Cor Biosciences).
For immunoprecipitation analysis, lysates were pre-cleared using protein G Sepharose beads (Sigma-Aldrich, GE17-0618-01), for 1 h at 4 °C on an orbital shaker. An equal amount of pre-cleared lysate was incubated with the primary antibody for 12 h, followed by an additional 4-h incubation with protein G sepharose beads. The resulting immune complexes were isolated by centrifugation, washed at least three times with ice-cold RIPA buffer and resuspended in 2× SDS sample buffer. Protein complexes were resolved by SDS–PAGE and western blot analysis. The primary antibodies used were mouse anti-MYC (1:3,000, EMD Millipore, 05-724), rabbit anti-ASNS (1:3,000 or 1:7,500, Proteintech, 14681-1-AP), mouse anti-DNA-PKcs (1:1,000, Cell Signaling Technology, 12311), rabbit anti-RPL3 (1:3,000, Proteintech, 11005-1-AP), mouse anti-β-actin (1:5,000, Santa Cruz Biotechnology, sc-47778), mouse anti-GFP (1:5,000, Santa Cruz Biotechnology, sc-9996), rabbit anti-FASN (1:2,000, Proteintech, 10624-2-AP), rabbit anti-FANCI (1:3,000, Proteintech, 20789-1-AP), mouse anti-VCP (1:1,000, Invitrogen, MA3-004), rabbit anti-PYGL (1:1,000, Proteintech, 15851-1-AP), rabbit anti-TUBGCP2 (1:1,000, ABclonal, A10283 and 1:3,000, Proteintech, 25856-1-AP), mouse anti-KPNB1 (1:1,000, EMD Millipore, 05-1530), rabbit anti-WRNIP1 (1:1,000, ABclonal, A9170 and 1:2,000, Santa Cruz Biotechnology, sc-376438), rabbit anti-ALDOA (1:3,000, Proteintech, 11217-1-AP), rabbit anti-FBL (1:1,000, ABclonal, A1136), rabbit anti-EIF4A1 (1:2,000, ABclonal, A5294), mouse anti-Flag (1:3,000, Cell Signaling Technology, 8146), rabbit anti-Flag (1:3,000, Cell Signaling Technology, 14793), rabbit anti-E6AP (1:1,000, Bethyl, A300-351A), rabbit anti-LDHB (1:3,000, Proteintech, 14824-1-AP), rabbit anti-eIF2α (1:1,000, Cell Signaling Technology, 5324), rabbit anti-phospho-eIF2α (1:1,000, Cell Signaling Technology, 3398), mouse anti-HA (1:3,000, BioLegend, 901501), rabbit anti-HA (1:3,000, Abcam, ab9110), rabbit anti-ubiquitin (1:3,000, Cell Signaling Technology, 58395), mouse anti-ubiquitin (P4D1) (1:1,000, Santa Cruz, sc-8017), rabbit anti-GCN2 (1:1,000, Cell Signaling Technology, 3302), rabbit anti-GCN2 (phospho T899) (1:1,000, Abcam, ab75836), rabbit anti-PERK (1:1,000, Cell Signaling Technology, 3192), rabbit anti-phospho-PERK (1:1,000, Cell Signaling Technology, 3179), rabbit anti-EIF2AK2 (PKR) (1:1,000, Proteintech, 18244-1-AP) and rabbit anti-EIF2AK1 (HRI) (1:3,000, Proteintech, 20499-1-AP).
In vitro and in vivo ubiquitination assays
In vitro ubiquitination assays were done using recombinant human ubiquitin-activating enzyme UBE1 (R&D Systems, E-305), recombinant UBCH7 (UBE2L3; R&D Systems, E2-640), recombinant human E6AP (UBE3A; R&D Systems, E3-230), recombinant human ubiquitin (R&D Systems, U-100H), recombinant human ASNS (R&D Systems, 10193-AS-020), 10× E3 ligase reaction buffer (500 mM HEPEs (pH 8.0), 500 mM NaCl and 10 mM TCEP)) and ATP (Sigma, A9187). Assays were performed as described previously. In brief, a single reaction contained 0.1 µM UBE1, 1 µM UBE2L3 (UbcH7), 50 µM ubiquitin, 2 mM Mg2+-ATP, 0.25 µM UBE3A and 0.125 μM ASNS. The reaction was allowed to proceed at 37 °C for the indicated time. Reactions were stopped by adding SDS sample buffer and boiling for 5 min at 95 °C. The samples were subjected to western blotting using an anti-ASNS antibody (Proteintech, 14681-1-AP).
To detect in vivo ASNS ubiquitination, hippocampi were collected from P43 WT and Angelman mice and lysed under denaturing conditions using a lysis buffer containing 25 mM HEPES (pH 7.4), 1% Triton X-100, 15 mM KCl, 5 mM EDTA, 1% SDS and EDTA-free protease inhibitor cocktail (Thermo Fisher Scientific, 78437). The resulting lysates were boiled for 30 min, and cellular debris was removed by centrifugation at 15,000g. Equal amounts of lysate from each genotype were diluted 1:10 (v/v) in a lysis buffer without SDS. Lysates were pre-cleared with protein G sepharose beads and endogenous ASNS protein was immunoprecipitated using an ASNS antibody (Proteintech, 14681-1-AP) for 12 h at 4 °C. The final immune complexes were washed three times with a lysis buffer containing 125 mM NaCl and then boiled for 10 min at 95 °C in LDS sample buffer. The resulting samples were visualized using an anti-ubiquitin antibody (1:1,000, Cell Signaling Technology, 3936).
To monitor the ubiquitination of ASNS lysine mutants, HEK293T cells transfected with HA-tagged ASNS mutants and Flag-tagged ubiquitin were treated with 30 μM MG132 (Calbiochem, 474790) for 4 h to inhibit proteasome activity. Cells were then lysed in a lysis buffer containing 25 mM HEPES (pH7.4), 1% Triton X-100, 15 mM KCl, 5 mM EDTA, 1% SDS and EDTA-free protease inhibitor cocktail (Thermo Fisher Scientific, 78437). Lysates were diluted in lysis buffer without SDS and pre-cleared with protein G sepharose beads, and ASNS was immunopurified using an HA antibody (EMD Millipore, 05-904) for 4 h at 4 °C, followed by a further 12-h incubation with protein G Sepharose beads. Ubiquitination was detected using a Flag antibody in western blot analysis.
Immunofluorescence
For brain tissue staining, WT and Angelman mice were anaesthetized and transcardially perfused with ice-cold PBS, followed by 4% paraformaldehyde (PFA), and the brains were dissected. Brains were further fixed overnight at 4 °C in 4% PFA. After fixation, the brains were cryopreserved and sectioned into 20–30-µm-thick slices. Sections were permeabilized with 0.5% Triton X-100 in PBS for 30 min, followed by blocking with a solution containing 5% bovine serum albumin (BSA), 1% normal donkey serum and 0.2% Triton X-100 in PBS for 1 h. Sections were incubated with primary antibodies (rabbit anti-ASNS, 1:800, Proteintech, 14681-1-AP; guinea pig anti-GABA, 1:500, EMD Millipore, AB175; guinea pig anti-NeuN; 1:3,000, EMD Millipore, ABN90; mouse anti-NeuN, 1:3.000, Abcam, ab104224; mouse anti-GFAP, 1:3,000, EMD Millipore, MAB360; goat anti-IBA1, 1:3,000, Novus Biologicals, NB100-1028; goat anti-5-HT, 1:3;000, ImmunoStar, 20079; mouse anti-TH, 1:3,000, ImmunoStar, 22941; sheep anti-neuropeptide Y, 1:1,000, EMD Millipore, AB1583; mouse anti-parvalbumin, 1:1,000, Swant, PV235; goat anti-calretinin, 1:1,000, Swant, CG1; rat anti-somatostatin, 1:1,000, EMD Millipore, MAB354; and mouse CaMKII-α, 1:1,500, Cell Signaling Technology, 50094) overnight for 4 °C. The following day, sections were incubated with secondary antibodies conjugated with Alexa Fluor dyes (488 AffiniPure donkey anti-rabbit, 1:2,000, Jackson ImmunoResearch Laboratories, 711-545-152; 647 AffiniPure donkey anti-guinea pig, 1:1,000, Jackson ImmunoResearch Laboratories, 706-605-148; 647 AffiniPure donkey anti-goat, 1:2,000, Jackson ImmunoResearch Laboratories, 705-605-147; 647 donkey anti-mouse, Thermo Fisher Scientific, A-31571; 647 AffiniPure donkey anti-rat, 1:1,000, Jackson ImmunoResearch Laboratories, 712-605-153; 568 donkey anti-mouse, 1:2,000, Invitrogen, A10037; and 568 donkey anti-sheep, 1:1,000, Thermo Fisher Scientific, A-21099) for 2 h at room temperature with gentle rocking. In the last 10 min of the incubation, nuclei were stained with Hoechst 33342 (Thermo Fisher Scientific, H3570) or DAPI (Sigma-Aldrich, D9542) for 10 min. Afterwards, sections were washed three times with PBST (PBS with 0.1% Tween 20), mounted on slides using Vectashield mounting medium (Vector Laboratories, H-1000) and imaged using an Olympus FV1299 confocal microscope. Fluorescence images were analysed using ImageJ software (v.1.53c).
In vivo and in vitro protein synthesis assay (BONCAT and FUNCAT)
To assess in vivo protein synthesis, we dissolved AHA (Thermo Fisher Scientific, C10102) in PBS. Mice were intraperitoneally injected at a dose of 50 μg AHA per g body weight. After 16 h, brains were collected (excluding the cerebellum) and a hemisphere was processed for BONCAT45. Proteins were extracted in RIPA buffer (20 mM Tris-HCl (pH 7.5), 150 mM NaCl, 1% Triton X-100, 0.1% sodium dodecyl sulfate, 1 mM EDTA, 1 mM EGTA and 1% sodium deoxy-cholate), supplemented with a protease (Thermo Fisher Scientific, 78437) and phosphatase (Thermo Fisher Scientific, 78428) inhibitor cocktail. To collect AHA-labelled proteins, 200 μg protein was incubated with 100 µM sDIBO-alkyne-conjugated biotin (Thermo Fisher Scientific, C20023) to biotinylate AHA-containing proteins through a copper-free click chemical reaction at room temperature for 2 h. Biotinylated proteins were then purified using streptavidin-conjugated dynabeads (50 μg; Thermo Fisher Scientific, 11205D). Purified proteins were detached from dynabeads by boiling in 1× SDS sample buffer. Eluted samples were processed for western blot analysis and visualized with the Revert 700 Total Protein Stain Kit (Li-Cor Biosciences, 926-11010).
Neurons cultured on coverslips were treated with 1 mM AHA (Click Chemistry Tools, 1066-100) for 4 h. Cells were then fixed in 4% PFA for 15 min at room temperature and processed for FUNCAT33. Fixed cells were blocked in a 5% BSA solution and incubated with 10 μM Click-iT Alexa Fluor 555 sDIBO alkyne (Invitrogen, C20021), a fluorescent compound that reacts with the azido group of proteins containing AHA, at room temperature for 2 h. Cell nuclei were stained with DAPI (Sigma-Aldrich, D9542). Coverslips were mounted in Vectashield (Vector Laboratories, H-1000) and imaged using an Olympus FV1200 scanning confocal microscope.
LC–MS metabolomics
All snap-frozen hippocampal tissue from WT, Angelman, Het and Rescue mice were weighed at the start of the extraction. Metabolites were extracted from frozen hippocampus samples using an Omni Bead Ruptor Elite Homogenizer with an acetonitrile:methanol:water ratio of 2:2:1 at a volume of 40 μl per mg of tissue. Samples were incubated at −20 °C for 1 h, then centrifuged for 10 min at 20,000g at 4 °C. The supernatant was transferred into a LC–MS vial for analysis on the same day46. Ultra-high-performance LC (UHPLC)–MS was performed with a Thermo Fisher Scientific Vanquish Horizon UHPLC system interfaced with a Thermo Fisher Scientific Orbitrap ID-X Tribrid mass spectrometer. Polar metabolites were separated on a HILICON iHILIC-(P)-Classic column (100 × 2.1 mm, 5 μm). The mobile-phase solvents were composed of: A = 20 mM ammonium bicarbonate, 2.5 μM medronic acid and 0.1% ammonium hydroxide in water:acetonitrile 5:95. The column compartment was maintained at 45 °C. The following linear gradient was applied at a flow rate of 0.25 ml min−1: 0 min, 90% B; 12 min, 35% B; 12.5–14.5 min, 25% B; and 15 min, 90% B. The injection volume was 4 μl. Data were acquired in both positive- and negative-ion mode. LC–MS data were processed and analysed with the open-source Skyline software (v.23.1)47.
qPCR
Total RNA was isolated using TRIzol reagent (Thermo Fisher Scientific, 15596026) according to the manufacturer’s instructions. cDNA synthesis was performed with a SMARTScribe reverse transcriptase (Takara, 639536). The following primers were used: forward, 5′-GCAGTGTCTGAGTGCGATGAA-3′ and reverse, 5′-TCTTATCGGCTGCATTCCAAAC-3′ for mouse Asns; forward, 5′-GGCTGTATTCCCCTCCATCG-3′ and reverse, 5′-CCAGTTGGTAACAATGCCATGT for mouse β-actin. For qPCR, we used the PowerUp SYBR Green master mix (Applied Biosystems, A25742) and reactions were performed on a QuantStudio 6 Flex Real-Time PCR machine (Applied Biosystems). Calculations of relative expression were performed using the comparative Ct method.
Behavioural testing
Before each test, mice were acclimatized to the testing room and the experimental set-up for several days. All tests were performed during the light period of the light–dark cycle, except for sleep and circadian rhythm experiments. We chose the number of mice used in our study according to published guidelines for Ube3am−/p+ mice12 and aimed to achieve a similar ratio of males and females in each genotypic group. Mice were tested by random distribution of genotypes and data analyses were performed by experimenters who were blinded to genotype.
In this study, a total of 138 mice were used for hindlimb clasping, marble burying and brain weight measurements (at P90 and P150): 33 WT (12 males, 21 females), 26 Angelman (15 males, 11 females), 40 Het (16 males, 24 females) and 39 Rescue (22 males, 17 females). For the open field and accelerating rotarod tests, a total of 71 mice were used: 16 WT (5 males, 11 females), 13 Angelman (5 males, 8 females), 19 Het (12 males, 7 females) and 23 Rescue (12 males, 11 females).
Hindlimb clasping assay
Mice at P35 were manually suspended by the tips of their tails at a distance of 30.5 cm from the surface of the bench. Each mouse underwent two trials with a 5-min interval between trials. The presence of hindlimb clasping behaviour was recorded for 30 s during each trial using a Sony HDR-CX405 camera. Hindlimb clasping behaviour was measured by the movement of the hindlimbs (one or both) retracting and curling inward toward the mouse’s body. Data are presented as the total time spent clasping across the two trials.
Open field
To assess general locomotor activity and approach or avoidance (anxiety-like) behaviours, P56 mice were placed individually in a 40 × 40-cm square chamber illuminated by a 30-lx LED light source. Locomotor activity was measured in the centre of the arena for 1 h, following published protocols48. The chamber was divided into specific zones: a central zone occupying the middle 50% of the total chamber area and a perimeter zone encompassing the outer 50%. Movement in the arena was quantified in terms of distance travelled, as well as time spent in and the number of entries into the centre and perimeter zones.
Accelerating rotarod
The accelerating rotarod test was performed at speeds ranging from 4 to 40 rpm over a duration of 300 s. Mice underwent a total of eight trials per day for four consecutive days, with all trials of the first day performed on a stationary rod for habituation. To assess their performance, the average time spent on the rotarod across all trials was calculated.
Marble burying
Polycarbonate cages with open tops were filled with a layer of aspen wood chips, approximately 4 cm deep, provided by the Division of Comparative Medicine at Washington University School of Medicine in St. Louis. On top of the aspen wood chips, a total of 20 black marbles were evenly arranged in a grid format of 5 rows and 4 columns. A mouse at P85 was allowed to interact with these marbles for a period of 45 min. Afterwards, the mouse was transferred back to its home cage and the cage with marbles was photographed. Marbles that were covered by aspen wood chips to an extent greater than 50% were counted as buried.
Measurement of sleep and wake states
The Adapt-A-Base sleep monitoring system for mice (Signal Solutions, model MB-ACN10) is an automated and highly sensitive piezoelectric sleep monitor that uses short-duration (2-s) pressure-signal segments to ascribe a sleep or wake statistic. The non-invasive and high-throughput system detects breathing and gross body movements to analyse unsupervised sleep–wake patterns with 90% accuracy when compared with electroencephalogram (EEG) and electromyogram (EMG)-based methods49,50. Mice (n = 6 per group) were individually housed in Ancare N10 mouse cages (Ancare) and placed on the Adapt-A-Base systems in sound- and light-proof circadian cabinets (Actimetrics) under 12-h light–12-h dark cycle (light on from 06:00 to 18:00; 300 lx) with ad libitum access to food, water and nesting material. Each cage was furnished with 160 g corn-cob bedding, 220 g food pellets and 380 ml water so that each cage weighed the same except for a small variability between mouse body weight. After 5 days of acclimation, the sleep–wake states were recorded without disturbance over 7 days using PiezoSleep v.2.08 (Signal Solutions). Sleep data were analysed for multiple sleep features of individual mice using SleepStats v.2.18 (Signal Solutions), and 30-s epochs were used for scoring sleep or wake bout lengths.
Measurement of circadian locomotor activity
Mice (n = 7–9 per group) were individually housed in Ancare N10 mouse cages (Ancare) mounted with passive infrared sensor wireless nodes (Actimetrics) and acclimated for 5 days. Daily locomotor activity was recorded at 1-min intervals using the ClockLab Wireless data collection program v.4.129 (Actimetrics) under 12-h light–12-h dark cycle (light on from 06:00 to 18:00; 300 lx) for the first 7 days, followed by constant dark for the next 21 days with ad libitum access to food, water and nesting material. Period length (tau) was determined by χ2 periodogram analysis, rhythm strength was measured by relative fast Fourier transform analysis and other features of circadian locomotor activity were measured using ClockLab Analysis v.6.1.02 (Actimetrics). All routine mouse care during the dark phase was performed under dim red light.
RNA-seq analysis
Cortices and hippocampi were dissected on ice in PBS from WT, Angelman, Het and Rescue littermates at P21 (n = 6 mice per genotype; WT, 3 males, 3 females; Angelman, 4 males, 2 females; Het, 3 males, 3 females; and Rescue, 3 males, 3 females). Tissue was flash-frozen in liquid nitrogen, lysed and the RNA was extracted using the RNeasy Plus Mini Kit (QIAGEN, 74134) following the manufacturer’s instructions. Libraries were generated from 10 ng of RNA using the SMART-Seq Stranded Kit (Takara, 634443) for Illumina and sequenced on an Illumina NextSeq 550 1×75 bp at the Edison Family Center for Genomic Sciences and Systems Biology at Washington University School of Medicine. Our sequencing yielded an average of 8.20 × 10⁶ 75-bp single-end reads per sample. RNA-seq quality control was performed using FastQC51 (v.0.11.9) and MultiQC52 (v.1.9), followed by adapter and quality trimming with Trim Galore (v.0.6.7; Q ≥ 20, minimum length 36 bp). Ribosomal RNA reads were removed by Bowtie253 (v.2.4.4) alignment to mouse rRNA sequences (NR_003278.3, NR_003279.1 and NR_046144.1), and the remaining reads were aligned to the GRCm39 genome (GCF_000001635.27) using STAR54 (v.2.7.11b), allowing up to ten multi-mapping locations per read. Gene-level counts were generated with featureCounts55 (v.2.1.1; Subread) using reverse strand specificity (-s 2), counting exon-mapped reads and excluding multi-mapping reads. Differential expression analysis was performed using edgeR56 (v.4.0.16) in R after retaining genes with counts per million (CPM) > 1 in fewer than three samples and TMM normalization; generalized linear models included sex (~Sex + Genotype) for tissue-specific analyses with significance assessed by quasi-likelihood F-tests (FDR < 0.05). For exon-level analysis of Ube3a (NM_011668.3) and Asns (NM_012055.5), featureCounts was run in exon mode (-f) with reverse strand specificity (-s 2) and fractional assignment of multi-mapping reads (-M–fraction), and exon counts from RefSeq Select transcripts were normalized by exon length to obtain counts per kilobase.
Spatial transcriptomic analysis
Using the Allen Institute’s whole-mouse-brain single-cell RNA-seq dataset, we calculated the mean and variance of Asns log2 expression and its corresponding log2 expression z-score (computed using the scanpy.tl.score_genes function57) for each annotated cell type identified58. These gene-expression scores were then mapped onto the corresponding cell types in the Allen Institute’s annotated MERFISH spatial transcriptomics dataset58. Spatial maps were generated by colouring each cell type according to its Asns expression using the ggplot2 package59 in R (v3.4.4).
Single-cell analysis
The single-cell genomics tool Seurat (v.4)60 was used for scRNA-seq data analysis. We followed the workflow described in the Seurat guided analysis on datasets normalized with SCTransform to normalize gene-expression levels. Principal component analysis was performed using the top 30 principal components. Uniform manifold approximation and projection (UMAP) analysis was performed with the top 30 dimensions. Clusters were identified with the functions FindNeighbors (dims = 1:30) and FindClusters (resolution = 0.8). A resolution of 0.8 was selected for the downstream analysis because clusters were clearly separated and matched visual inspection. Default parameters were used unless noted. For identified clusters, cluster marker analysis confirmed that they were transcriptionally distinct, with their unique marker genes. Major cell types and five different neuronal cell populations were annotated on the basis of the expression of unique markers as described in the original publication23, including astrocytes (Gfap, Aldh1l1 and Aqp4), endothelial cells (Ly6c1), oligodendrocytes (Mobp, Mog and Plp1), perivascular macrophages (Mrc1 and Lyve1), mural cells (Acta2), microglia (Tmem119, P2ry12 and Cx3cr1), ependymoma cells (Foxj1) and neuronal subpopulations N-Tbr1, N-Grp, N-Lhx6, N-Synpr and N-Spink8.
Statistical analysis
Statistical analyses were performed using GraphPad Prism (v.10).
Reporting summary
Further information on research design is available in the Nature Portfolio Reporting Summary linked to this article.