Cell culture
All cell lines used are listed in Supplementary Table 1.
Growth media
hTert-RPE1 and MCF7 cells were cultured at 37 °C and 5% CO2 with the corresponding growth conditions: DMEM (Gibco, 11594486) supplemented with 10% fetal bovine serum (FBS; Gibco F7514) and 1% penicillin–streptomycin (Gibco 15140); KU1919 and HBLAK cells were cultured under the same environmental conditions, but the media were RPMI 1640 (Gibco, A1049101) and Cnt Prime (Cellntec, CnT-PR), respectively.
Cell maintenance
All cell lines were routinely tested for mycoplasma using an enzyme-linked immunosorbent assay test kit (MycoAlert, LT07-318). Cells in culture were routinely split 1:10 every 3–4 days. For cell splitting, cells were washed with phosphate-buffered saline (PBS) and detached by incubation for 3 min with Gibco Trypsin-EDTA (0.25%) and phenol red (Gibco; 25200056) before being replated in fresh media. Accutase (Thermo Fisher Scientific, 00-4555-56) was used for HBLAK cells.
Cell synchronization
Contact inhibition
hTert-RPE1 cells were arrested in G0/G1 by contact inhibition so that they reached 100% confluency for 3 days in a 6-well plate. After 6 days, cells were replated at low cell density in serum-free DMEM for 24 h, according to the protocol described in ref. 25. Cells were released into the cell cycle with addition of serum-containing DMEM (as above for growth medium).
CDK4/6i
hTert-RPE1 cells were treated with 0.5–1 µM palbociclib (Selleckchem, S4482) for 24 h to arrest cells in G0/G1 (ref. 51). Cells were washed three times with PBS to release cells back into the cell cycle with addition of full growth medium. KU1919 cells were treated with 1 µM palbociclib for 24 h, then washed three times with PBS to release cells back into the cell cycle with addition of full growth medium. MCF7 cells were treated with 1 µM palbociclib for 24 h, before being washed three times with PBS and released into the cell cycle with addition of appropriate medium plus serum.
Escherichia coli transformation
Chemically competent E. coli DH5a cells (NEB, C2987H) were used for transformation. Competent cells were thawed on ice for 30 min, after which 0.5 μg of the plasmid DNA of interest was added, followed by incubation on ice for a further 20 min. To facilitate the uptake of plasmid DNA, the cells were subjected to heat shock for 45 s at 42 °C in a water bath and subsequent incubation on ice for 2 min. After this, 250 μl of room-temperature SOC medium was added to the cells, and the mixture was incubated in a horizontal shaker at 37 °C for 1 h. The bacteria were then spread on the appropriate antibiotic-containing LB agar plates and incubated at 37 °C overnight.
Generation of CDH1 mutant plasmids
Generation of CDH1 mutant plasmids carrying Y91E, Y130E and T129D
CDH1 mutant plasmids carrying Y91E, Y130E or T129D or combinations of these mutations are listed in Supplementary Table 2. All point mutations were introduced in the HA-CDH1 plasmid (Addgene, 11596) by Gibson assembly with Gibson Assembly Master Mix (E2611S, NEB), according to the manufacturer’s instructions. The Y91E fragments were PCR-amplified with forward primer 5′-ctggggacgtcggagcaagc-3′ and reverse primer 5′-agggcagaCTCGGCCAGGCCGTCTTTG-3′ for the insert and forward primer 5′-ggccGAGTCTGCCCTGCTCAAGAATG-3′ and reverse primer 5′-gctccgacgtccccaggcagaatgg-3′ for the backbone. The Y130E fragments were PCR-amplified with forward primer 5′-ctggggacgtcggagcaagc-3′ and reverse primer 5′-gggaCTCcgtgaacagacccttcttc-3′ for the insert and forward primer 5′-ggtctgttcacgGAGtcccttagcacca-3′ and reverse primer 5′-gctccgacgtccccaggcagaatgg-3′ for the backbone. The Y91E/Y130E fragments were PCR-amplified with forward primer 5′-ggccGAGTCTGCCCTGCTCAAGAATG-3′ and reverse primer 5′-gggaCTCcgtgaacagacccttcttc-3′ for the insert and forward primer 5′-ggtctgttcacgGAGtcccttagcacca-3′ and reverse primer 5′-agggcagaCTCGGCCAGGCCGTCTTTG-3′ for the backbone. The Y91E/T219D/Y130E fragments were PCR-amplified with forward primer 5′-ggccGAGTCTGCCCTGCTCAAGAATG-3′ and reverse primer 5′-gggaCTCGTCgaacagacccttcttctcaggc-3′ for the insert and forward primer 5′-ggtctgttcGACGAGtcccttagcacca-3′ and reverse primer 5′-agggcagaCTCGGCCAGGCCGTCTTTG-3′ for the backbone. Subsequently, CDH1 WT and mutated sequences were subcloned in the pHY22 (ref. 52) plasmid backbone by Gibson assembly. The pHY22 backbone was PCR-amplified using forward primer 5′-GGATCGATCCTCTAGAGTCGACCT-3′ and reverse primer 5′-GCCATATGCGGTAAAATAACGTTTA-3′. HA-CDH1 WT and mutated sequences were PCR-amplified using forward primer 5′-TTTACCGCATATGGCatggaccaggactatgagcg-3′ and reverse primer 5′-CTAGAGGATCGATCCttaccggatcctggtgaagagg-3′.
Generation of CDH1 N186 mutant plasmids carrying Y91F, Y130F and Y91F/Y130F
Plasmids expressing the N-terminal 186 residues of human CDH1 (WT, Y91F, Y130F and Y91F/Y130F) with a C-terminal His6 tag were generated by PCR amplification of the corresponding double-stranded gBlocks (Integrated DNA Technologies, BVBA) using primers containing 5′ NdeI and 3′ BamHI sites. The PCR products were digested with NdeI and BamHI and subcloned into the pET-NGST vector. All constructs were confirmed by DNA sequencing.
Cell line generation
Generation of endogenous WEE1–GFP–AID-tagged hTert-RPE1 cell line
The GFP–AID–P2A–Neo tag (a gift from Francis Barr’s laboratory53) was inserted at the C terminus of the endogenous WEE1 coding sequence using CRISPR–Cas9-mediated editing.
gRNA cloning. The guide RNA (gRNA) used was forward 5′-ACCTCCCCTGAACACTGTG-3′, reverse 5′-CACAGTGTTCAGGGGGAGGT-3′. This gRNA sequence was cloned into pX459 pSpCas9 using the Bbsl restriction enzyme. pSpCas9(BB)−2A-Puro (PX459) V2.0 was a gift from F. Zhang (Addgene plasmid 62988)54.
Homology donor cloning. The genomic region surrounding WEE1 exon 11 (C terminus) was PCR-amplified from hTert-RPE1 genomic DNA using forward primer 5′-agtatttggcctattaaatttgtgttg-3′ and reverse primer 5′-tgcaaattgaagtgataatgttatttc-3′. WEE1 exon 11 was cloned into the pJet vector (Thermo Fisher), and the sequence was verified by Sanger sequencing. For construction of the homology donor plasmid, WEE1 homology arms were PCR-amplified from pJet–WEE1 exon 11 using high-fidelity Q5 DNA polymerase (NEB), according to the manufacturer’s instructions. For PCR amplification of the left homology arm, the following primers were used (the 5′ overhangs for Gibson assembly are underlined): forward primer 5′-acggtatcgataagcttgatattcttttgatttattgcag-3′ and reverse primer 5′-gccccaccaccgctccaccgtatatatagtaaggctgacag-3′. For PCR amplification of the right homology arm, forward primer 5′-cttcttgacgagttcttctgagactactcctttcacacctcc-3′ (the base mutated to change the PAM site in the recombined gene is shown in bold) and reverse primer 5′-ccgggctgcaggaattcgatgataaaaatatattttgtg-3′ were used. GFP–AID–GSG–P2A–Neo was PCR amplified from plasmid pFB8580 (provided by Francis Barr’s laboratory53) using forward primer 5′-ggtgggagcggtggtggcg-3′ and reverse primer 5′-tcagaagaactcgtcaagaaggcgat-3′. The pBluescript (pSKII) vector was digested with EcoRV.
All PCR products were run on 0.8% TBE agarose gels, and bands were gel extracted and assembled into EcoRV-digested pSKII(-) using Gibson assembly with a NEB HiFi Assembly kit, according to the manufacturer’s instructions for four-way assembly. The final homology donor plasmid and the pX459 plasmid containing the gRNA were sequenced using Sanger sequencing to confirm the correct sequence.
Generation of WEE1–GFP–AID-tagged cell line. For generation of the tagged cell lines, hTert-RPE1 MYC-OsTIR1 cells (expressing a doxycycline-inducible MYC–OsTIR1 construct; a gift from H. Hochegger55) were seeded in a 6-well plate at 5 × 10⁴ cells per well in 1.5 ml of growth medium, 1 day before transfection. The next day, cells were forward transfected with Lipofectamine 2000 and 500 ng of pX459-gRNA and 500 ng of pSK-WEE1–GFP–AID–P2A–Neo. Cells were allowed to recover for 24 h before trypsinization and seeding in a 15-cm plate with fresh growth media. The next day, 1 mg ml−1 of G418 (Thermo Fisher) was added to the plate; then, fresh medium plus G418 was added every 3–4 days until single colonies became visible. Single-cell colonies were picked using cloning cylinders (Sigma). Positive clones were identified by nuclear GFP fluorescence and analysed by western blot. We confirmed that this cell line had the expected nuclear localization of WEE1–GFP (Extended Data Fig. 2b) and that it grew with normal kinetics (Extended Data Fig. 2d).
Generation of endogenous CDC25A–GFP-tagged hTert-RPE1 cell line
gRNA cloning. For generation of the gRNA targeting the C terminus of human CDC25A for CRISPR–Cas9-mediated gene-tagging, gRNA forward primer 5′-caccgaagaagctctgagggcggc-3′ and gRNA reverse primer 5′-aaacgccgccctcagagcttcttc-3′ were annealed and ligated into BbsI-digested pSpCas9(BB)−2A-Puro (PX459) V2.0.
Homology donor cloning. For PCR amplification of the CDC25A left and right homology arms from hTert-RPE1 genomic DNA, we used NEB Q5 High Fidelity DNA polymerase and the following primers: for the left homology arm (the 5′ overhangs for Gibson assembly are underlined), forward 5′-acggtatcgataagcttgatgtgaaggtgctgggcaggactc-3′ and reverse 5′-cgccaccaccgctcccaccgagcttcttcagacgactgtac-3′; for the right homology arm (the base mutated to remove the PAM sequence in recombined DNA is shown in bold), forward 5′-atcgccttcttgacgagttcttctgagggcggcatgaccagccagcag-3′ and reverse 5′-ccgggctgcaggaattcgatcagagcacctagctttctgtcc-3′. GFP–GSG–P2A–Neo was PCR amplified from plasmid pFB8606 (provided by Francis Barr’s laboratory53), using the following primers: P2A-CT linker forward 5′-ggtgggagcggtggtggcg-3′ and P2A-CT Neo reverse 5′-tcagaagaactcgtcaagaaggcgat-3′.
All PCR products were run on 0.8% TBE agarose gels, and bands were gel extracted and assembled into EcoRV-digested pSKII(-) using Gibson assembly with a NEB HiFi Assembly kit, according to the manufacturer’s instructions for four-way assembly. The final homology donor plasmid and the pX459 plasmid containing the gRNA were sequenced using Sanger sequencing to confirm the correct sequence.
Generation of CDC25A–GFP-tagged cell line. hTert-RPE1 mRuby–PCNA cells56 in a six-well plate (Sarstedt, 83.3920) were forward transfected with Lipofectamine 2000 and 500 ng of pX459-gRNA and 500 ng of pSK-CDC25A-CT-GFP, according to the manufacturer’s protocol, and left to recover overnight. The next day, cells were split into 15-cm tissue culture dishes (Corning, 420599) and, 24 h later, clones were selected with 1 mg ml−1 G418. Media and antibiotic were refreshed every 3–4 days. After 2 weeks, single colonies were selected using cloning cylinders (Sigma) and transferred to 24-well plates. Cells were expanded and initially screened for GFP positivity in the nucleus. Genomic DNA was extracted from cells with GFP-positive nuclei, using a Qiagen DNeasy blood and tissue kit, according to the manufacturer’s instructions. To check for targeted integration of the C-terminal tagging construct, the following primers were used: 5′-atgtacagtcgtctgaag and 5′-taccacagcgcctcctgg. All PCR products were sequenced by Sanger sequencing to check for in-frame tagging. Clones were then further validated by western blotting, growth curves and single-cell imaging to check cell cycle phase lengths. We obtained several heterozygously tagged clones that had a slightly decreased proliferation rate, mainly owing to an increase in G1 length (Extended Data Fig. 6b–e). CDC25A–GFP localized correctly to the nucleus (Extended Data Fig. 6f). In unperturbed cells released from CDK4/6i G0/G1 arrest, CDC25A–GFP showed accumulation around the G1/S transition, as previously described57.
PCNA tagging in hTert-RPE1 MYC-OsTir1 WEE1–GFP–AID–Neo cells
For endogenous expression of the PCNA reporter, the sequence encoding fluorescent protein mRuby was inserted in the first exon of one allele of the PCNA locus by recombinant adeno-associated virus (rAAV)-mediated homologous recombination56 in the hTert-RPE1 MYC-OsTir1 WEE1–GFP–AID–Neo cell line. Then, 293T cells were seeded in a T-75 flask so that they reached 50–70% confluence at the time of transfection. pAAV–mRuby–PCNA (3 μg; gift from Joerg Mansfeld, ICR56) and pRC and pHelper plasmids (9 μg total) were mixed with 3.75 ml of Opti-MEM (Invitrogen), after which 19 μl of PLUS Reagent (Invitrogen) was added, and the mixture was incubated for 5–10 min at room temperature. Next, 47 μl of Lipofectamine LTX (Invitrogen) was added to the tube, followed by incubation for 30 min. 15 minutes before the end of the incubation, 293T cells were washed twice with PBS; then, 7.5 ml of Opti-MEM (Invitrogen) was added, and the cells were incubated at 37 °C for 15 min. After this, 1.5 ml of DNA/lipid mixture was added to the cells, followed by incubation at 37 °C for 4–6 h, and then the medium was replaced with complete DMEM. 2–3 days postinfection, cells in medium (and any floating cells) were transferred to a sterile 50-ml Falcon tube. Then, 5 ml of fresh medium was added to the flask, and adherent cells were scraped off and transferred to the same 50-ml Falcon tube. Cells were lysed with three rounds of freezing and thawing (10 min in dry ice and ethanol + 10 min in a water bath at 37 °C). After each cycle, cells were vortexed at full speed for 1 min. Cells were then centrifuged at 10,000g for 30 min at 4 °C. Tubes were wiped with ethanol and placed in the tissue culture hood. Cell-free supernatants were collected, and rAAV preparations were dispensed in small aliquots (3–5 ml). hTert-RPE1 MYC-OsTir1 WEE1–GFP–AID–Neo cells were seeded in a T-75 flask so that they reached 30–40% confluence at the time of infection. The T-75 flask was washed twice with PBS; then, 5 ml of complete medium and 5 ml of rAAV stock were added, and the flask was left to incubate at 37 °C for 4 h. Fresh media were added to bring the volume up to 15 ml (or more), and infection was allowed to continue for 48 h. After 3 days, mRuby–PCNA-positive cells were sorted to single-cell density in 50:50 conditioned/growth media in 96-well plates by fluorescence-activated cell sorting (FACS). Cells were left to expand for 2 weeks, and mRuby–PCNA-positive clones were identified by microscopy.
Generation of p21-knockout cell lines
p21-knockout MCF7, KU1919 and HBLAK cell lines were generated as previously described34. The only modification was that HBLAK cells were transfected by nucleofection on the Amaxa nucleofector, using the MCF7 protocol. Knockouts were validated by immunostaining and western blotting for p21 after Nutlin-3 treatment, to boost the p21 signal.
siRNA transfection
All siRNAs used are listed in Supplementary Table 4. For live imaging and western blotting experiments, cells were reverse transfected with siRNA in 384-well PhenoPlates (Revvity) and 24-well plates (Greiner Bio-One, 662165), respectively. For imaging experiments, transfection was carried out 24 h after CDK4/6 inhibition in a total volume of 30 µl of medium and used at a final concentration of 20 nM. Transfection was performed using Lipofectamine RNAiMAX (Invitrogen 13778150), according to the manufacturer’s instructions. In brief, 40 nl of Lipofectamine RNAiMAX was added to 40 nl of 20 µM siRNA in 10 µl Opti-MEM (Gibco 31985062), and 10 µl of the mixture was subsequently added to cells. Following transfection, cells were incubated for 6–24 h, depending on the experiment. For western blotting, this protocol was carried out with the following differences: cells were grown in 500 µl of medium; and 1 µl of Lipofectamine RNAiMAX was added to 1 µl of 20 µM siRNA in 100 µl Opti-MEM, and the mixture was subsequently added to cells. Following transfection, cells were incubated for 6–24 h, depending on the experiment.
Immunostaining
All antibodies used for immunostaining are listed in Supplementary Table 5. Cells were grown in 96- or 384-well PhenoPlates (Revvity, 6055302 and 6057302, respectively). EdU was added to a final concentration of 10 μM for either 12–24h at G0 release or with a 30-min pulse before fixation for identification of G0 and S phase cells, respectively. Cells were fixed in 4% formaldehyde–PBS for 15 min at room temperature, permeabilized with PBS–0.5% Triton X-100 for 15 min and blocked for 1 h in blocking buffer (PBS with 2% bovine serum albumin (BSA), filtered). Primary antibodies were diluted in blocking buffer and incubated overnight at 4 °C or for 2 h at room temperature. After three washes in PBS, cells were incubated for 1 h at room temperature in the dark with conjugated secondary antibodies (1:1,000; Invitrogen). For EdU incorporation, cells were incubated with 100 mM Tris-HCl pH 7.5, 4 mM CuSO4, 100 mM ascorbic acid and 5 μM sulfo-cyanine-5 azide for 30 min at room temperature in the dark, washed three times in PBS and counterstained with 1 μg ml−1 Hoechst for 10 min, followed by three washes in PBS. All plate-washing steps were performed on an automated 50TS microplate washer (BioTek). Plates were imaged using an Operetta CLS (Revvity) with a ×20 (numerical aperture (NA) 0.8) objective.
Automated image analysis of fixed cells
All automated image analysis of images acquired using Operetta CLS was performed using Harmony software (Revvity). Nuclei were segmented on the basis of Hoechst intensity, with nuclei at the edge of the field of view excluded from the analysis. The nuclear intensity of proteins was calculated as the mean intensity in the segmented region.
G0 calculation
G0 cells were identified by the absence of EdU staining. Briefly, the nuclear-to-cytoplasmic ratio was calculated by creation of a 4-pixel-width ring around the segmented nucleus, and the ring intensity was calculated as a proxy for the cytoplasmic portion. Nuclear-to-cytoplasmic ratios for individual cells were calculated and plotted in Prism (GraphPad). Cells with EdU nuclear-to-cytoplasmic ratios less than 1.2 were called as G0.
Western blotting
All antibodies used for western blotting are listed in Supplementary Table 4.
Whole-cell lysates were prepared following aspiration of medium from culture plates, followed by washing with PBS on ice. Lysates were collected in 1× Novex Tris-Glycine SDS sample buffer (Novex, LC2676) supplemented with 1× phosphatase inhibitors (Thermo Scientific, 1862495), 1× protease inhibitors (Thermo Scientific, 78429) and 1 mM dithiothreitol (DTT; BioUltra, 43816-10ML). Samples were incubated at 95 °C for 10 min, then centrifuged at 14,000g for 1 min before being loaded on a Novex 4–20% Tris-Glycine gel (Invitrogen, XP04205). Proteins were transferred to PVDF-FL membranes (Merck Life Sciences, IPFL00010), which were then blocked in blocking buffer (Tris-buffered saline (TBS), 5% milk, 10% glycerol, Tween 0.1%) for 1 h at room temperature and incubated with primary antibodies diluted in blocking buffer, overnight at 4 °C. Membranes were washed three times in TBS with 0.05% Triton X-100, then incubated for 1 h at room temperature with HRP-conjugated secondary antibodies diluted in blocking buffer. Membranes were then washed three times in TBS with 0.05% Triton X-100 and developed using Clarity Western ECL Substrate (Bio-Rad, 1705061) unless secondary antibodies were conjugated to Alexa Fluor. Blots were imaged on an Amersham Imager 680.
Doxycycline-inducible WEE1 degradation
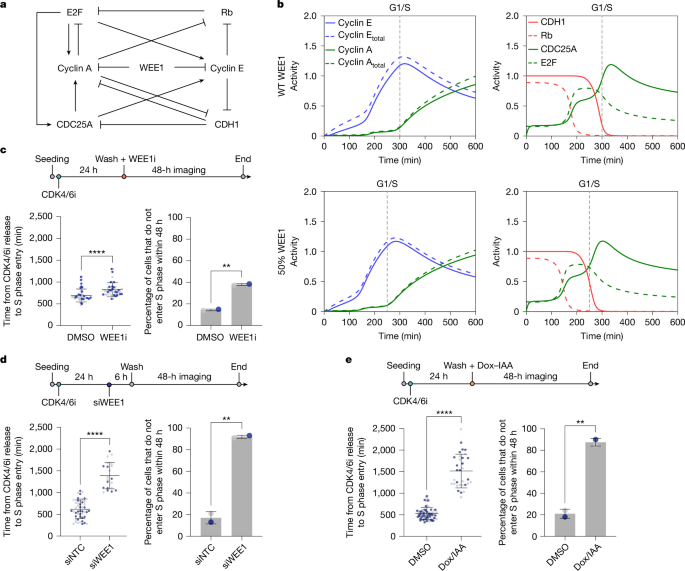
For live cell imaging involving WEE1 degradation with doxycycline and IAA, RPE1 WEE1–GFP–AID mRuby–PCNA cells were plated in 384-well PhenoPlates (Revvity) at a density of 500 cells per well in 20 µl medium. Cells were synchronized with 1 µM CDK4/6i for 24 h, and doxycycline and IAA (doxycycline: 1 µg ml−1; IAA: 500 µM) was added to the growth medium when cells were released. For western blots, doxycycline or IAA was also added at release.
In vitro kinase assays
All purified proteins used for in vitro kinase assays are listed in Supplementary Table 6.
To confirm the activity of the WEE1 kinase, we carried out a positive control experiment with cyclin B1–CDK1. The in vitro kinase protocol was provided by J. Pines (ICR). For this reaction, 100 ng of recombinant cyclin B1–CDK1 (Abcam) was diluted in 5 µl of kinase buffer (200 mM Tris pH 7.5, 150 mM NaCl, 10 mM MgCl2, 1 mM DTT) with 0.5 mM ATP and 18 µM RO-3306 (CDK1 inhibitor, Selleckchem). This mixture was added to 50 ng of recombinant WEE1 (Thermo Fisher Scientific) diluted in 5 µl of kinase buffer with 0.5 µM MK-1775 (WEE1i, Selleckchem) for the negative control. A negative control without addition of WEE1 kinase was used. The reactions were incubated for 30 min at 30 °C, stopped by addition of 5 µl of 3× SDS buffer with 100 mM DTT and boiled at 95 °C for 5 min. Samples were then used for western blotting as described, with the exception that milk was replaced with BSA at the blocking step. pY15-CDK1/2/3/5 and CDK1 antibodies were used to quantify pY15-CDK1 phosphorylation. For monitoring of phosphorylation of CDH1 on tyrosine residues by WEE1, 80 ng of recombinant Strep–CDH1 was diluted in 5 µl of kinase buffer with 0.5 mM ATP. This mixture was added to 50 ng of recombinant WEE1 diluted in 5 µl of kinase buffer with 0.5 µM MK-1775 for the negative control. A negative control without kinase addition was also carried out. The reactions were incubated for 30 min at 30 °C, stopped by addition of 5 µl of 3× SDS buffer with 100 mM DTT and boiled at 95 °C for 5 min. As for the cyclin B1–CDK1 reaction, samples were analysed by western blotting. The phospho-tyrosine antibody pTyr-100 and CDH1 antibody were used to quantify phosphorylation of tyrosine residues on CDH1. For the results shown in Extended Data Fig. 7g, 1.5 µg of bacterially expressed and purified Xenopus GST-FZR N186 (Cdh1) or GST-FZY N159 (Cdc20) protein58 was incubated with 160 ng recombinant WEE1 kinase (Thermo Fisher Scientific) in 10 µl kinase buffer. Samples were collected at the indicated time points and analysed by SDS–PAGE and immunoblotting using an anti-phospho-tyrosine antibody (pTyr-100). For the results shown in Extended Data Fig. 7j, bacterially expressed and purified human GST–CDH1 N186 or its tyrosine variants were incubated with recombinant WEE1 kinase in the same kinase buffer for 10 min and analysed by SDS–PAGE and immunoblotting using the same anti-phospho-tyrosine antibody.
CDC6–mVenus protein stability assay
For monitoring of CDC6–mVenus stability upon WEE1 inhibition, hTert-RPE1 CDC6–mVenus DHB–mCherry mTurq2–PCNA cells were plated in a 24-well plate at a density of 50,000 cells per well. Cells were arrested with CDK4/6i for 24 h and treated with WEE1i (1 µM) or DMSO upon release. 2 h after release, cells were treated with cycloheximide (100 µg ml−1) every 30 min for 2 h. Subsequently, cells were lysed in 1× Novex Tris-Glycine SDS sample buffer (Novex, LC2676) supplemented with 1× phosphatase inhibitors (Thermo Scientific, 1862495), 1× protease inhibitors (Thermo Scientific, 78429) and 1 mM DTT (BioUltra, 43816-10ML).
CDC6–mVenus and CDC25A protein levels upon proteasome inhibition
For monitoring of CDC6–mVenus and CDC25A protein levels upon WEE1 and proteasome inhibition, hTert-RPE1 CDC6–mVenus DHB–mCherry mTurq2–PCNA cells were plated in a 24-well plate at a density of 50,000 cells per well, or hTert-RPE1 cells were plated in a 6-well plate at a density of 300,000 cells per well. Cells were arrested with CDK4/6i for 24 h and treated with WEE1i (1 µM) or DMSO upon release. 2 h after release, cells were treated with proteasome inhibitor MG132 (10 µM) for 2 h. Subsequently, cells were lysed in 1× Novex Tris-Glycine SDS sample buffer (Novex, LC2676) supplemented with 1× phosphatase inhibitors (Thermo Scientific, 1862495), 1× protease inhibitors (Thermo Scientific, 78429) and 1 mM DTT (BioUltra, 43816-10ML).
CDC25A mRNA fluorescence in situ hybridization
For monitoring of CDC25A transcription levels, hTert-RPE1 cells were plated in a 96-well plate at a density of 5,000 cells per well. Cells were arrested with CDK4/6i for 24 h and treated with WEE1i (1 µM) or DMSO upon release. 4 h after release, cells were fixed in 4% formaldehyde in PBS for 15 min at room temperature. Cells were then processed with a ViewRNA-ISH cell assay kit (Thermo Scientific, QVC0001). In brief, cells were permeabilized with proteases; then, the CDC25A probe (VA6-3168938 ViewRNA Type 6 probe set CDC25A, Thermo Scientific) was hybridized for 3 h at 40 °C. Subsequently, the preamplifier was hybridized for 30 min at 40 °C, followed by hybridization with the amplifier for 30 min at 40 °C and finally hybridization with the label probe for 30 min at 40 °C. Nuclei were stained with DAPI, and the plate was imaged using an Operetta CLS (Revvity) with a ×40 water (NA 1.1) objective. The cytoplasm was imaged with the digital phase contrast channel. Cytoplasmic segmentation was performed with Harmony software (Revvity) using Find Cytoplasm method D, and cellular CDC25A mRNA foci were detected with Find Spots method A.
Expression and purification of Strep–CDH1
Expression and purification of Strep–CDH1 was performed using a method similar to that described in ref. 59, with some modifications. Specifically, codon-optimized complementary DNAs of Strep–CDH1 in pFastBac1 vectors were ordered from GeneArt (Thermo Fisher Scientific) and transformed into MultiBac cells for expression in insect cells. The baculovirus was created in Sf9 cells; this virus was then used to infect Hi5 cells at a cell density of 1 × 10⁶ cells ml−1, followed by incubation for 72 h at 27 °C, 130 rpm. All purification steps were carried out at 4 °C. First, the cell pellet was thawed on ice in wash buffer (50 mM Tris-HCl pH 7.3, 500 mM NaCl, 5% glycerol, 0.5 mM TCE)] supplemented with 5 units ml−1 benzonase and an EDTA-free protease inhibitor (Roche). The cells were sonicated and then centrifuged for 1 h at 48,000g. The supernatant was then bound to a 5-ml StrepTactin Superflow Plus cartridge (Qiagen) using a flow rate of 1 ml min−1. The column was washed extensively with wash buffer and then eluted using elution buffer (50 mM Tris-HCl pH 7.0, 200 mM NaCl, 5% glycerol, 0.5 mM TCEP and 2.5 mM desthiobiotin).
CDH1–APC/C binding assays
Hs CDH1 WT or tyrosine mutant proteins (Y91E, Y130E, Y91E/Y130E, or Y91E/T129D/Y130E), prepared using a coupled in vitro transcription–translation system (TnT, Promega), were mixed with Xenopus egg interphase extracts for 30 min at 23 °C. Endogenous APC/C was then immunoprecipitated using Dynabeads crosslinked to the AF3.1 anti-APC3 antibody. The immobilized APC/C was washed twice with 1× XBcsf-MS (10 mM HEPES-KOH pH 7.8, 50 mM sucrose, 300 mM KCl, 2 mM MgCl2 and 5 mM EGTA) containing 0.01% NP-40, eluted in 1× SDS sample buffer and analysed by SDS–PAGE and immunoblotting.
Cell-free APC/C-dependent destruction assay
Destruction assays were performed essentially as described previously60. APC/C substrates were labelled with [35S]methionine/cysteine (Hartmann Analytic) using TnT (Promega, UK). CDH1-mediated destruction assays were carried out in Xenopus egg cell-free interphase extracts supplemented with Hs CDH1 WT or tyrosine mutant proteins prepared by TnT. Full-length cyclin B and cyclin B Δ67, which lacks the D-box, served as positive and negative controls, respectively. Samples were taken at the indicated time points and analysed by SDS–PAGE and autoradiography.
Proteomics
To determine the tyrosine residues phosphorylated by WEE1 on CDH1, the reactions (5 replicates per condition) were carried out as described in the ‘In vitro kinase assays’ section, with the exception that the reactions were stopped with addition of 1 M guanidine hydrochloride. We diluted 5 μl of the kinase reaction with 45 μl water containing TCEP (final concentration 10 mM) and chloracetamide (20 mM). The reaction was incubated at 37 °C to reduce and alkylate Cys, and digestion was initiated by addition of trypsin and LysC at final concentrations of 5 ng µl−1 and 10 ng µl−1, respectively. After overnight digestion the samples were desalted on 3 mg of oasis HLB buffer. The samples were evaporated in a SpeedVac and resuspended in 30 µl of 0.1% trifluoroacetic acid, and 5 µl was analysed using liquid chromatography–mass spectrometry.
Chromatographic separation was performed using an Ultimate 3000 RSLC nano liquid chromatography system coupled to a Exploris 240 mass spectrometer with an EASY-Spray source. Electrospray ionization was achieved with Bruker PepSep emitters (PN: PSFSELJ10, 10 µm). Peptide solutions were injected directly on to the analytical column (self-packed column, CSH C18 1.7-µm beads, 150 μm × 30 cm) at a working flow rate of 1.25 μl min−1 for 4 min. Peptides were then separated using a 60-min stepped gradient: 0–45% of buffer B for 70 min (composition of buffer A: 95%:5% H2O/DMSO + 0.1% formic acid; composition of buffer B: 75%:20%:5% MeCN/H2O/DMSO + 0.1% formic acid), followed by column conditioning and equilibration. Eluted peptides were analysed in data-independent acquisition (DIA) mode: an initial MS1 scan was carried out at 140,000 resolution with an AGC target of 3e6 for a maximum IT of 200 ms, m/z range: 410–1,600. This was followed by 30 MS2 scans at 30 K resolution covering 410–1,600 with variable window sizes predicted by encyclopeDIA. The AGC target was set to 3e6 with maximum IT on auto. Normalized collision energy was set to 27%.
Data were processed using the Spectronaut software platform (Biognosys, 19.9.250512.62635) in direct DIA mode. Searches were carried out against Spodoptera frugiperda concatenated with the human WEE1 sequence, the Trichoplusia ni protein sequence database concatenated with the human CDH1 sequence and a universal protein contaminants database61. For the DIA analysis, higher stringency settings were used than in the default workflow as described previously62. Default settings were used for posttranslational modification analysis, with the probability cutoff for posttranslational modification localization set to 0, before table export. To account for CDH1 intensity variance at the protein level, phospho-site intensities were also normalized to the total protein level. Specific sites of interest were validated using the Spectronaut feature viewer.
The two identified phospho-sites were located on the DGLAY[phospho (Y)]SALLK–Y91 and GLFTY[phospho (Y)]SLSTK–Y130 peptides, both with 2+ charge. We reran the samples targeting the peptides in parallel reaction monitoring and single ion monitoring modes at 240 K resolution and 500 ms maximum injection time. The mass spectrometry proteomics data have been deposited at the ProteomeXchange Consortium through the PRIDE63 partner repository with dataset identifier PXD068577.
Fluorescence-activated cell sorting
FACS of cells was performed at the Flow Cytometry Facility, MRC Laboratory of Medical Sciences (MRC LMS). Cells were washed with PBS and resuspended in FACS sorting buffer (1 ml of PBS, 2% FBS) to a concentration of 8–12 million cells ml−1. Before sorting, cells were filtered through a 30- to 40-μM filter.
Growth curves
Cells were plated at a density of 1,000 cells per well in triplicate in 96-well tissue culture plates. Bright-field images were taken every 4 h for 7 days using a ×10 (NA 0.3) objective, and percentage confluency was calculated on a CellCyteX (Echo) live imaging system. For calculation of confluency, a mask was created using the default settings on the CellCyteX (brightness 0%, contrast 0%, contrast sensitivity 50 a.u., smoothing 2 a.u. and filled hole size 100 µm2). Results were plotted with Python (Seaborn package).
Drug dose curves
Cells were plated at a density of 500 cells per well in 20 µl of medium. For the drug dose curve assays with siRNA transfection, cells were transfected (10 µl) for 24 h before drug addition as described previously. MK-1775 was prepared by 7 × 1:3 serial dilutions (7 × 1:4 in the case of transfection) in growth medium with final concentrations for all assays of 100 µM, 10 µM, 1 µM, 0.1 µM, 0.01 µM and 0.001 µM. Ten microlitres were added per well. After 72 h of incubation, cells were fixed and stained for Hoechst. Plates were imaged using an Operetta CLS (Revvity) with a ×20 (NA 0.8) objective. Cell viability was calculated as a percentage, and normalized half-maximal inhibitory concentration (IC50) values were computed using GraphPad Prism.
EMI1 overexpression
hTert-RPE1 CCNB1–eYFP mTurq2–EMI1 53BP1-mCherry cells (a gift from R. Medema64) were seeded in a 384-well PhenoPlate (Revvity) at a density of 500 cells per well in 20 µl of medium. Cells were arrested for 24 h in CDK4/6i and then released with doxycycline (1 µg ml−1) to induce EMI1 expression, EdU, and DMSO or WEE1i for 12 h before fixation for identification of G0 cells. Cells were fixed in 4% formaldehyde–PBS for 15 min at room temperature, permeabilized with PBS–0.5% Triton X-100 for 15 min and blocked for 1 h in blocking buffer (PBS–2% BSA, filtered). For EdU incorporation, cells were incubated with 100 mM Tris-HCl pH 7.5, 4 mM CuSO4, 100 mM ascorbic acid and 5 μM sulfo-cyanine-5 azide for 30 min at room temperature in the dark, washed three times in PBS and counterstained with 1 μg ml−1 Hoechst for 10 min, followed by three washes in PBS. Inhibition of CDH1 was confirmed by western blot. Cells were plated at a density of 40,000 cells per well in a 24-well plate, then arrested for 24 h with CDK4/6i and released with addition of doxycycline to induce EMI1 expression (1 µg ml−1 and 10 µg ml−1) for 4 h before cell lysis in 1× Novex Tris-Glycine SDS sample buffer (Novex, LC2676) supplemented with 1× phosphatase inhibitors (Thermo Scientific, 1862495), 1× protease inhibitors (Thermo Scientific, 78429) and 1 mM DTT (BioUltra, 43816-10ML).
Time-lapse imaging
Live cell imaging was performed on an Operetta CLS High-Content Analysis microscope (Revvity), with atmospheric control to maintain cells at 37 °C and 5% CO2 and a breathable membrane (Thermo Fisher Scientific) to stop evaporation. Cells were plated in a 384-well PhenoPlate (Revvity) at a density of 500 cells per well in 20 μl of medium for 24 h (unless otherwise stated) before imaging. Cells were imaged using a ×20 (NA 0.8) objective at 10-min intervals for 48 h (unless otherwise stated) in 50 μl phenol red-free media. For hTert-RPE1 WEE1–GFP–AID mRuby–PCNA and hTert-RPE1 mRuby–PCNA CDC25A–GFP live imaging, cells were imaged on an automated inverted spinning disc confocal microscope system IX83 (Olympus) combined with CellVivo (Olympus). Cells were plated on IbiTreat μ-slide 8-well (ibidi) plates at a density of 5000 cells per well in 200 μl of medium or in a 384-well PhenoPlate (Revvity) at a density of 500 cells per well in 20 μl of medium, 24 h before imaging (unless otherwise stated). Images were typically acquired with a ×20 plan (UCPLFLN) fluorescence objective (NA 0.7).
Automated image analysis of live imaging experiments
Automated cell tracking (Nuclitrack)
Images were exported as tiff files and analysed using NucliTrack65 and/or Fiji and Napari66. All cells analysed were present throughout the entire movie unless they died. Spontaneous death was quantified manually. mRuby–PCNA was used to define cell cycle phases34,56. We defined S phase entry as the time point at which the mRuby–PCNA mean intensity started to increase and mRuby–PCNA switched from being homogenously localized throughout the nucleus to having a more textured appearance; PCNA binds to the chromatin at the start of S phase, which can be measured by an increase in the standard deviation of mRuby–PCNA intensity. Example images around the G1/S transition and the output of mRuby–PCNA features around the G1/S transition from Nuclitrack are shown in Extended Data Fig. 1e.
As shown in Fig. 3b, the standard deviation of mRuby–PCNA was used to quantify progression through S phase. Cells in G1 had a low standard deviation, as the mRuby–PCNA intensity was homogenous throughout the nucleus. As cells progressed through S phase, the standard deviation of mRuby–PCNA intensity increased as many small foci coalesced into larger, brighter foci, leading to very dark and very bright areas of the nucleus.
Automated cell tracking (Cellpose + Ultrack)
The code used for single-cell time-lapse image segmentation and tracking was implemented in Python (Jupyter notebook) and is available at GitHub ( This analysis pipeline combined Cellpose67 segmentation and tracking using Ultrack68 and was run using the Jex HPC cluster at the MRC LMS69. In brief, raw TIFF stacks (shape: T × Y × X) were background-subtracted using a rolling ball-style method with a Gaussian filter (σ = 15 px), followed by morphological reconstruction to separate foreground from low-frequency background. Frames were normalized (γ = 0.5) and stored in Zarr format for efficient chunked input–output. Normalized frames were processed with a Cellpose model (cpsam). Masks for each time point were generated, yielding per-frame two-dimensional label arrays written into a Zarr volume. A watershed was run on each frame to recover fine cell boundaries and split merged objects. Thresholding and binary morphology mask detections, followed by distance transform watershed with minima suppression, were performed to generate second label sets, which were also saved as Zarr. Graphics processing unit-accelerated boundary detection was implemented in CuPy; boundaries from both Cellpose and watershed masks were combined and smoothed (σ = 5) to create high-resolution contour maps for downstream linking. Centroids of watershed segments between frames were calculated. The Hungarian algorithm (linear_sum_assignment) was used to link cells, providing centroid-distance statistics (95th percentile, maximum, average and 25th percentile displacements) and informing Ultrack’s max_distance parameter. Ultrack was then configured and executed. For quality checks, tracks and labels were exported and visualized. Background subtraction was then applied to the channel of interest, and properties were exported.
Statistical analysis
Statistical analyses in this work were performed in GraphPad Prism unless otherwise stated.
Generation of MCF7 WEE1i-resistant cells
For generation of MCF7 WEE1i-resistant cells, MCF7 WT cells were plated on a 15-cm tissue culture dish (Corning, 420599) at a density of 5 × 10⁶ cells ml−1. Cells were treated with 0.075 µM MK-1775 24 h later and incubated until they reached confluence. Cells were then split and treated with a double amount of MK-1775 24 h later and incubated again until confluence. This step was repeated until 0.6 µM MK-1775 was reached. The resistance of these cells was measured against the parental cells with a 72-h drug dose curve (IC50).
RNA sequencing
MCF7-resistant and WT cells were plated at a density of 100,000 cells per well in a 6-well plate (Sarstedt, 83.3920). Twenty-four hours later, total RNA was extracted using an RNeasy MinElute Cleanup Kit (Qiagen 74204) according to the manufacturer’s instructions. Quality and concentration were assessed using the Agilent 2100 Bioanalyzer RNA 6000 Nano assay.
RNA sequencing libraries were constructed from 200 ng of total RNA using the Watchmaker Genomics mRNA enrichment and RNA Library Prep kits according to the manufacturer’s instructions. Libraries were dual indexed using IDT xGen Unique Dual Index Primers, and library quality was assessed by Agilent 2100 Bioanalyzer High-Sensitivity DNA assay. Libraries were pooled and run on an Illumina NextSeq 2000, generating a minimum of 60 million paired-end 60-bp reads per sample.
RNA sequencing reads were processed using cutadapt v.4.7 (ref. 70) to remove Illumina adapters, to quality trim at Q20, and to filter read pairs that contained N bases or in which either read was less than 31 bp. Processed reads were quantified with Salmon v.1.9.0 (ref. 71) using transcripts from the GRCh38 Ensembl v.107 annotations. Salmon’s expectation maximization procedures were set to enable modelling of sequencing and GC biases.
In R, transcript level counts from Salmon were imported and aggregated to the gene level using tximport v.1.32.0 (ref. 72). Sample quality assessments were performed in relation to collected RNA integrity values, sample concentrations used in library preparation (ng μl−1), read GC content and percentage read mapping. Normalization, further quality control based on principal component analysis and clustering using normalized values, and differential expression analyses were performed with DESeq2 v.1.44.0 (ref. 70). We conducted independent hypothesis weighting to optimize the power of P value filtering73 using IHW v.1.32.0 and log2 fold change shrinkage using ashr v.2.2-63 (ref. 74) to reduce the impact of low expression on estimation of fold change values. Multiple correction testing adjustments were optimized using thresholds for false discovery rate and log2 fold change at the point of generation of results in DESeq2. Significance was assessed using a q value of 0.01.
Cycloheximide CDH1 protein stability assay
To monitor CDH1 stability upon WEE1 inhibition, we plated RPE1 mRuby–PCNA cells in a 24-well plate at a density of 50,000 cells per well. Cells were arrested with CDK4/6i for 24 h and treated with WEE1i (1 µM) or DMSO and cycloheximide (100 µg ml−1) upon release. Subsequently, cells were lysed every hour for 4 h in 1× Novex Tris-Glycine SDS sample buffer (Novex, LC2676) supplemented with 1× phosphatase inhibitors (Thermo Scientific, 1862495), 1× protease inhibitors (Thermo Scientific, 78429) and 1 mM DTT (BioUltra, 43816-10ML).
APC/C activity calculation from time-lapse data
APC/C activity (kAPC) calculations based on mCherry–geminin levels (APC degron), expressed in the PIP-FUCCI hTert-RPE1 cell line75 (a gift from J. Cook, University of North Carolina at Chapel Hill), were calculated as previously described21,76. Specifically, we assumed degron dynamics were described by differential equation (1):
$$\frac{{\rm{d}}\,[\mathrm{APC}\,\mathrm{degron}]}{{\rm{dt}}}=\,{k}_{\mathrm{synth}}-{k}_{\mathrm{APC}}\,[\mathrm{APC}\,\mathrm{degron}],$$
(1)
where ksynth is the constitutive rate of APC degron synthesis and kAPC is the APC activity. The equation can be rearranged for kAPC:
$${k}_{{\rm{APC}}}=\frac{{k}_{{\rm{synth}}}-\,\frac{{\rm{d}}\,[{\rm{APC}}\,{\rm{degron}}]}{{\rm{dt}}}}{[{\rm{APC}}\,{\rm{degron}}]\,}.$$
(2)
Thus, we were able to use the fluorescence signal of our degron cell lines to estimate each term in equation (2).
First, we aligned our fluorescence intensity time series data from each cell to the G1/S transition point. Subsequently, we averaged the signal across cells at each time point and smoothed the data by calculating the three-point running mean. We then subtracted the background signal from the resulting value at each time point. The resulting series was a measure of degron concentration, corresponding to [APC degron], in arbitrary units. The derivative term was calculated by applying the finite difference method to the consecutive points of the [APC degron] time series. ksynth was estimated from the initial (net) rate of degron accumulation in S phase, when APC/C was assumed to be inactive.
Protein alignment
Clustal Omega77 was used to align CDH1 protein sequences, and outputs (consensus frequency of residues, identity matrix and phylogenetic tree) were plotted in Python.
Modelling
We built our cell cycle model using a system of coupled nonlinear differential equations describing the rates of change of biochemical species responsible for regulation of the G1 and S states. The regulation of subsequent cell cycle phases was omitted for simplicity, as our experimental approach was focused on quiescence release rather than cycling cells. A description of the modelling and the parameters used are available in the Supplementary Information.
Reporting summary
Further information on research design is available in the Nature Portfolio Reporting Summary linked to this article.